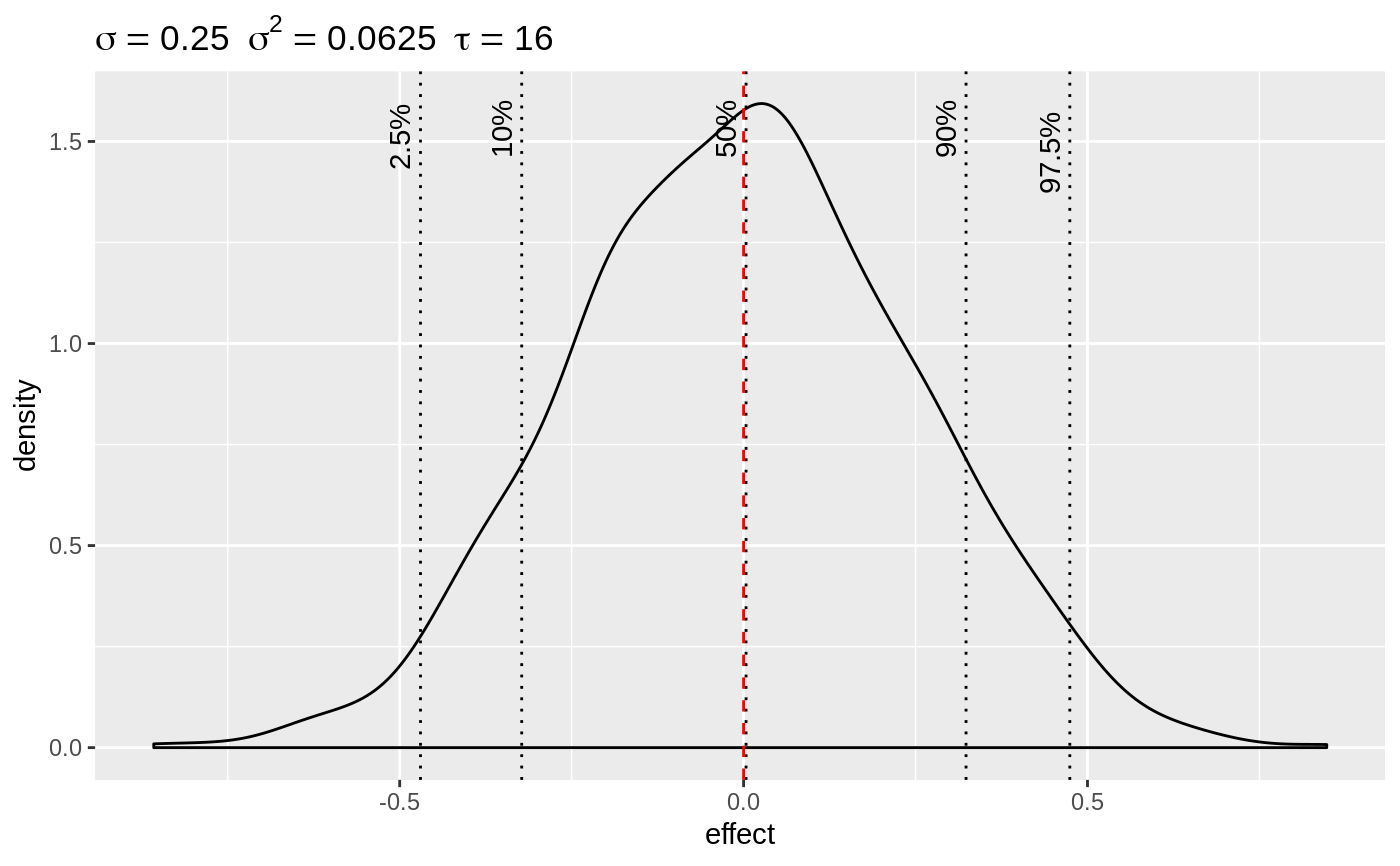
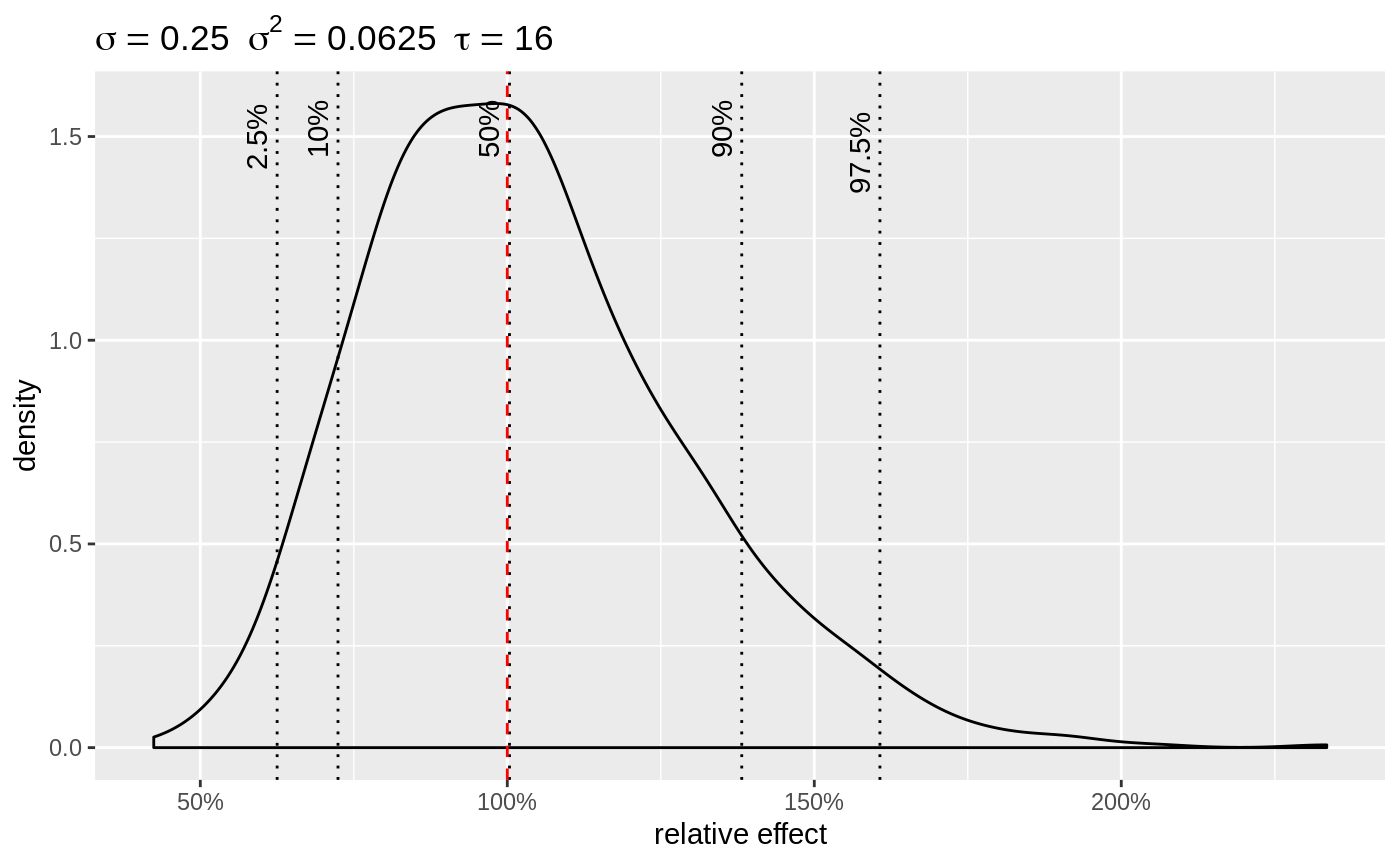
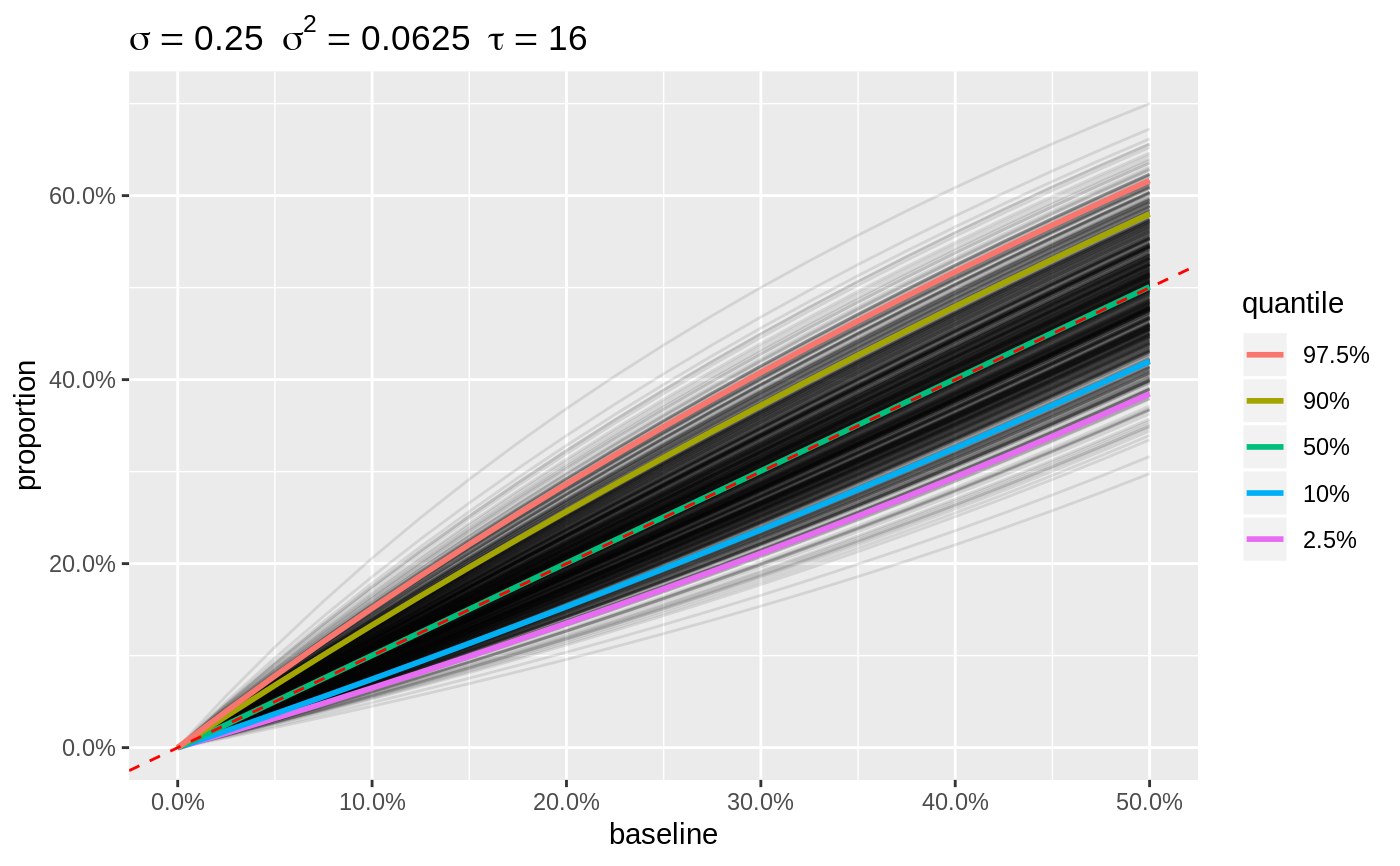
Plot simulated random intercepts
# S3 method for sim_iid
plot(x, y, ..., link = c("identity", "log", "logit"),
  baseline, center = c("mean", "bottom", "top"), quantiles = c(0.025,
  0.1, 0.5, 0.9, 0.975))
Arguments
| x | a |
|---|---|
| y | currently ignored |
| ... | currently ignored |
| link | which link to use for back transformation |
| baseline | optional baseline for the time series |
| center | defines how to center the time series to the baseline. Options are: |
| quantiles | which quantiles are shown on the plot |
Value
a ggplot2 object
See also
Other priors: plot.sim_rw,
select_change,
select_divergence,
select_poly, select_quantile,
simulate_iid, simulate_rw