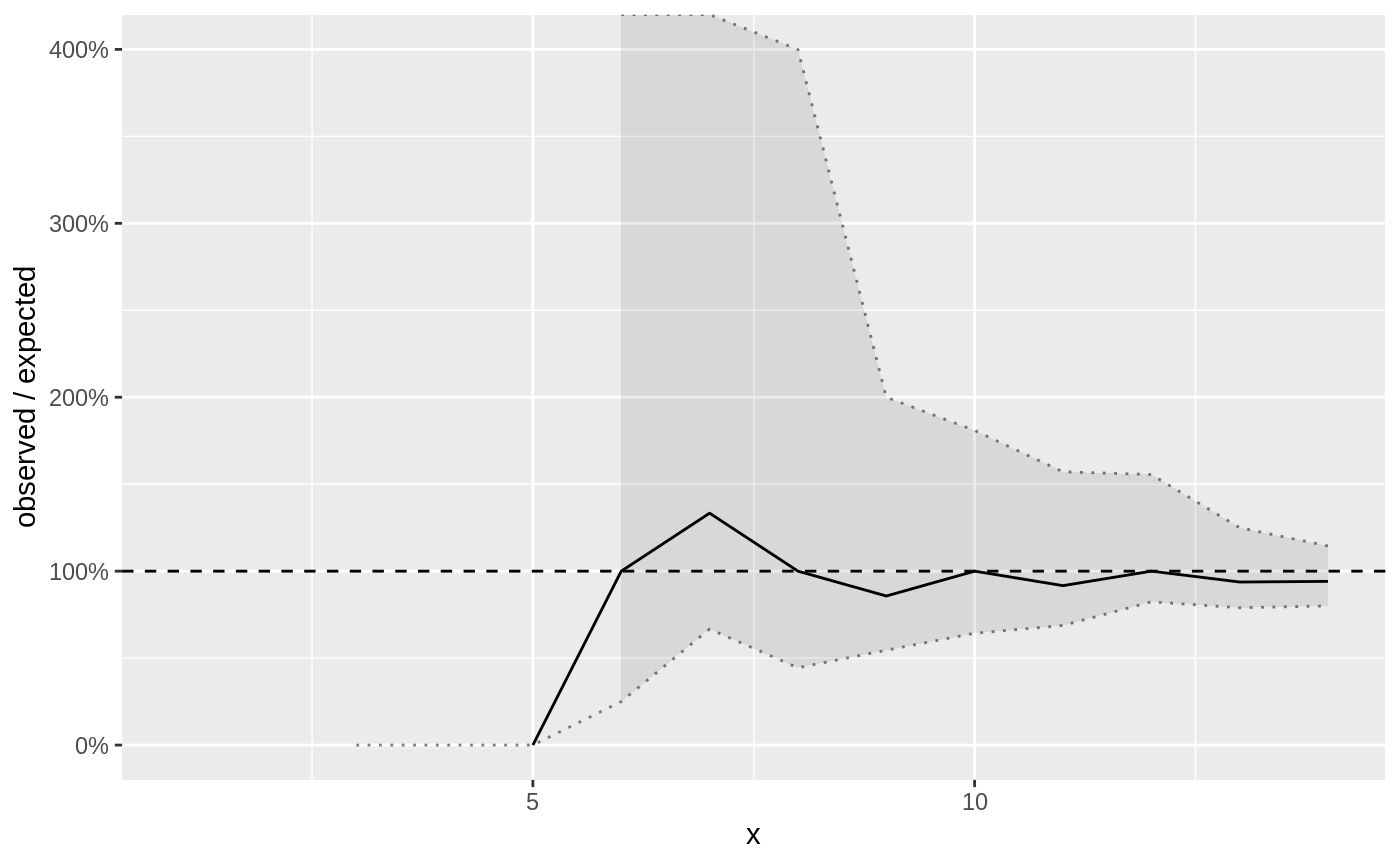
Plot the results from a distribution check
Source:R/plot_distribution_check.R
plot.distribution_check.RdPlot the results from a distribution check
# S3 method for distribution_check
plot(x, y, ..., n = FALSE,
  scales = "fixed")
Arguments
| x | a distribution_check object. Which is the output of
|
|---|---|
| y | currently ignored |
| ... | currently ignored |
| n | display the number of observations |
| scales | Should scales be fixed ( |
Value
a ggplot2 object
See also
Other utils: generate_data,
plot.dispersion_check
Examples
library(INLA)
set.seed(20181202)
model <- inla(
  poisson ~ 1,
  family = "poisson",
  data = data.frame(
    poisson = rpois(20, lambda = 10),
    base = 1
  ),
  control.predictor = list(compute = TRUE)
)
fdc <- fast_distribution_check(model)
plot(fdc)#> Warning: Removed 3 rows containing missing values (geom_path).#> Warning: Removed 2 rows containing missing values (geom_path).